
Audience Segmentation
Audience Segmentation is the core of a successful media strategy in Audience Flow. By grouping users based on their buying habits or engagement, you can send the right message to the right person.
This guide covers the complete workflow to create advanced segments like a "VIP Customers" group (e.g., defining them as users who have spent over $500 and purchased in the last 30 days). The content is divided into two main sections: first, how to prepare your raw data using Aggregation to create a "Single Customer View", and second, how to leverage that profile to build targeted audiences ready for export to Google or Meta.
If you already have aggregated data available, feel free to use the table of contents below to skip directly to the segmentation use cases.
Prerequisites
Access to the Audience Flow functionality
Table of Contents
Theory
The "Single Customer View"
The challenge
In Audience Flow, your goal is to send a list of emails or phone numbers among other customer data to ad platforms. However, your interesting data (how much they spent, when they last bought) is usually hidden in a separate "Orders" file where one customer appears on dozens of rows.
You cannot filter a list of emails based on a file of orders directly. You first need to summarize the orders.
Check: Do you actually need Aggregation?
Check your data structure to determine your starting point:
- I have "One row per customer" (e.g., a CRM export or an existing Life Time Value (LTV) file):
👉 You don't need aggregation. Skip to Step 3 of (make a segmentation) directly. - I have "One row per Order/Visit" (Multiple rows per customer):
👉 You cannot calculate "Total Spend" or "LTV" directly because the data is split across multiple rows. You must use Aggregation (Step 1) to summarize this into a single customer profile.
What is Aggregation?
Aggregation is the process of grouping multiple rows together based on a specific column (the "Key") and applying an action to summarize the other data. For each grouped element, you choose how to calculate the result: sum (total), count (number of items), avg (average), min/max or earliest/latest (lowest/highest value/time), or any/all value (pick any/all value).
The Concept: Grouping Purchases
Imagine you have a long list of all purchases mixed together. To know how much "Marie" spent in total, you can't just look at the scattered rows.
Aggregation is about organizing this list:
Choose a "Base" Column (The Grouping Key): You select the column that identifies the person (e.g., "Name"). All rows containing "Marie" will be grouped together to become one single row.
Define Actions for the Rest: For every other column (like Price or Date), you must decide how to summarize the information.
- Do you want to add up the prices? (
sum) - Do you want to find the most recent date? (
latest) - Do you just want to keep the name? (
any value)
The Result: From Rrows to Profiles
BEFORE (The Raw List):
Client_ID | Name | Date | Amount |
101 | Marie | 01/01/2024 | 100€ |
101 | Marie | 05/01/2024 | 50€ |
102 | Paul | 02/01/2024 | 200€ |
Problem: Marie appears on 2 separate rows.
AFTER (The Customer Profile):
Client_ID | Name | Last_Order (Max) | Total_Spent (Sum) |
101 | Marie | 05/01/2024 | 150€ |
102 | Paul | 02/01/2024 | 200€ |
Solution: Marie now has ONE row with her total spend.
You can now easily target "Users > 120€".
Make a segmentation
Step 1: Prepare Your Data with Aggregation
Goal: Transform your "Orders File" so that there is only one row per customer containing their stats.
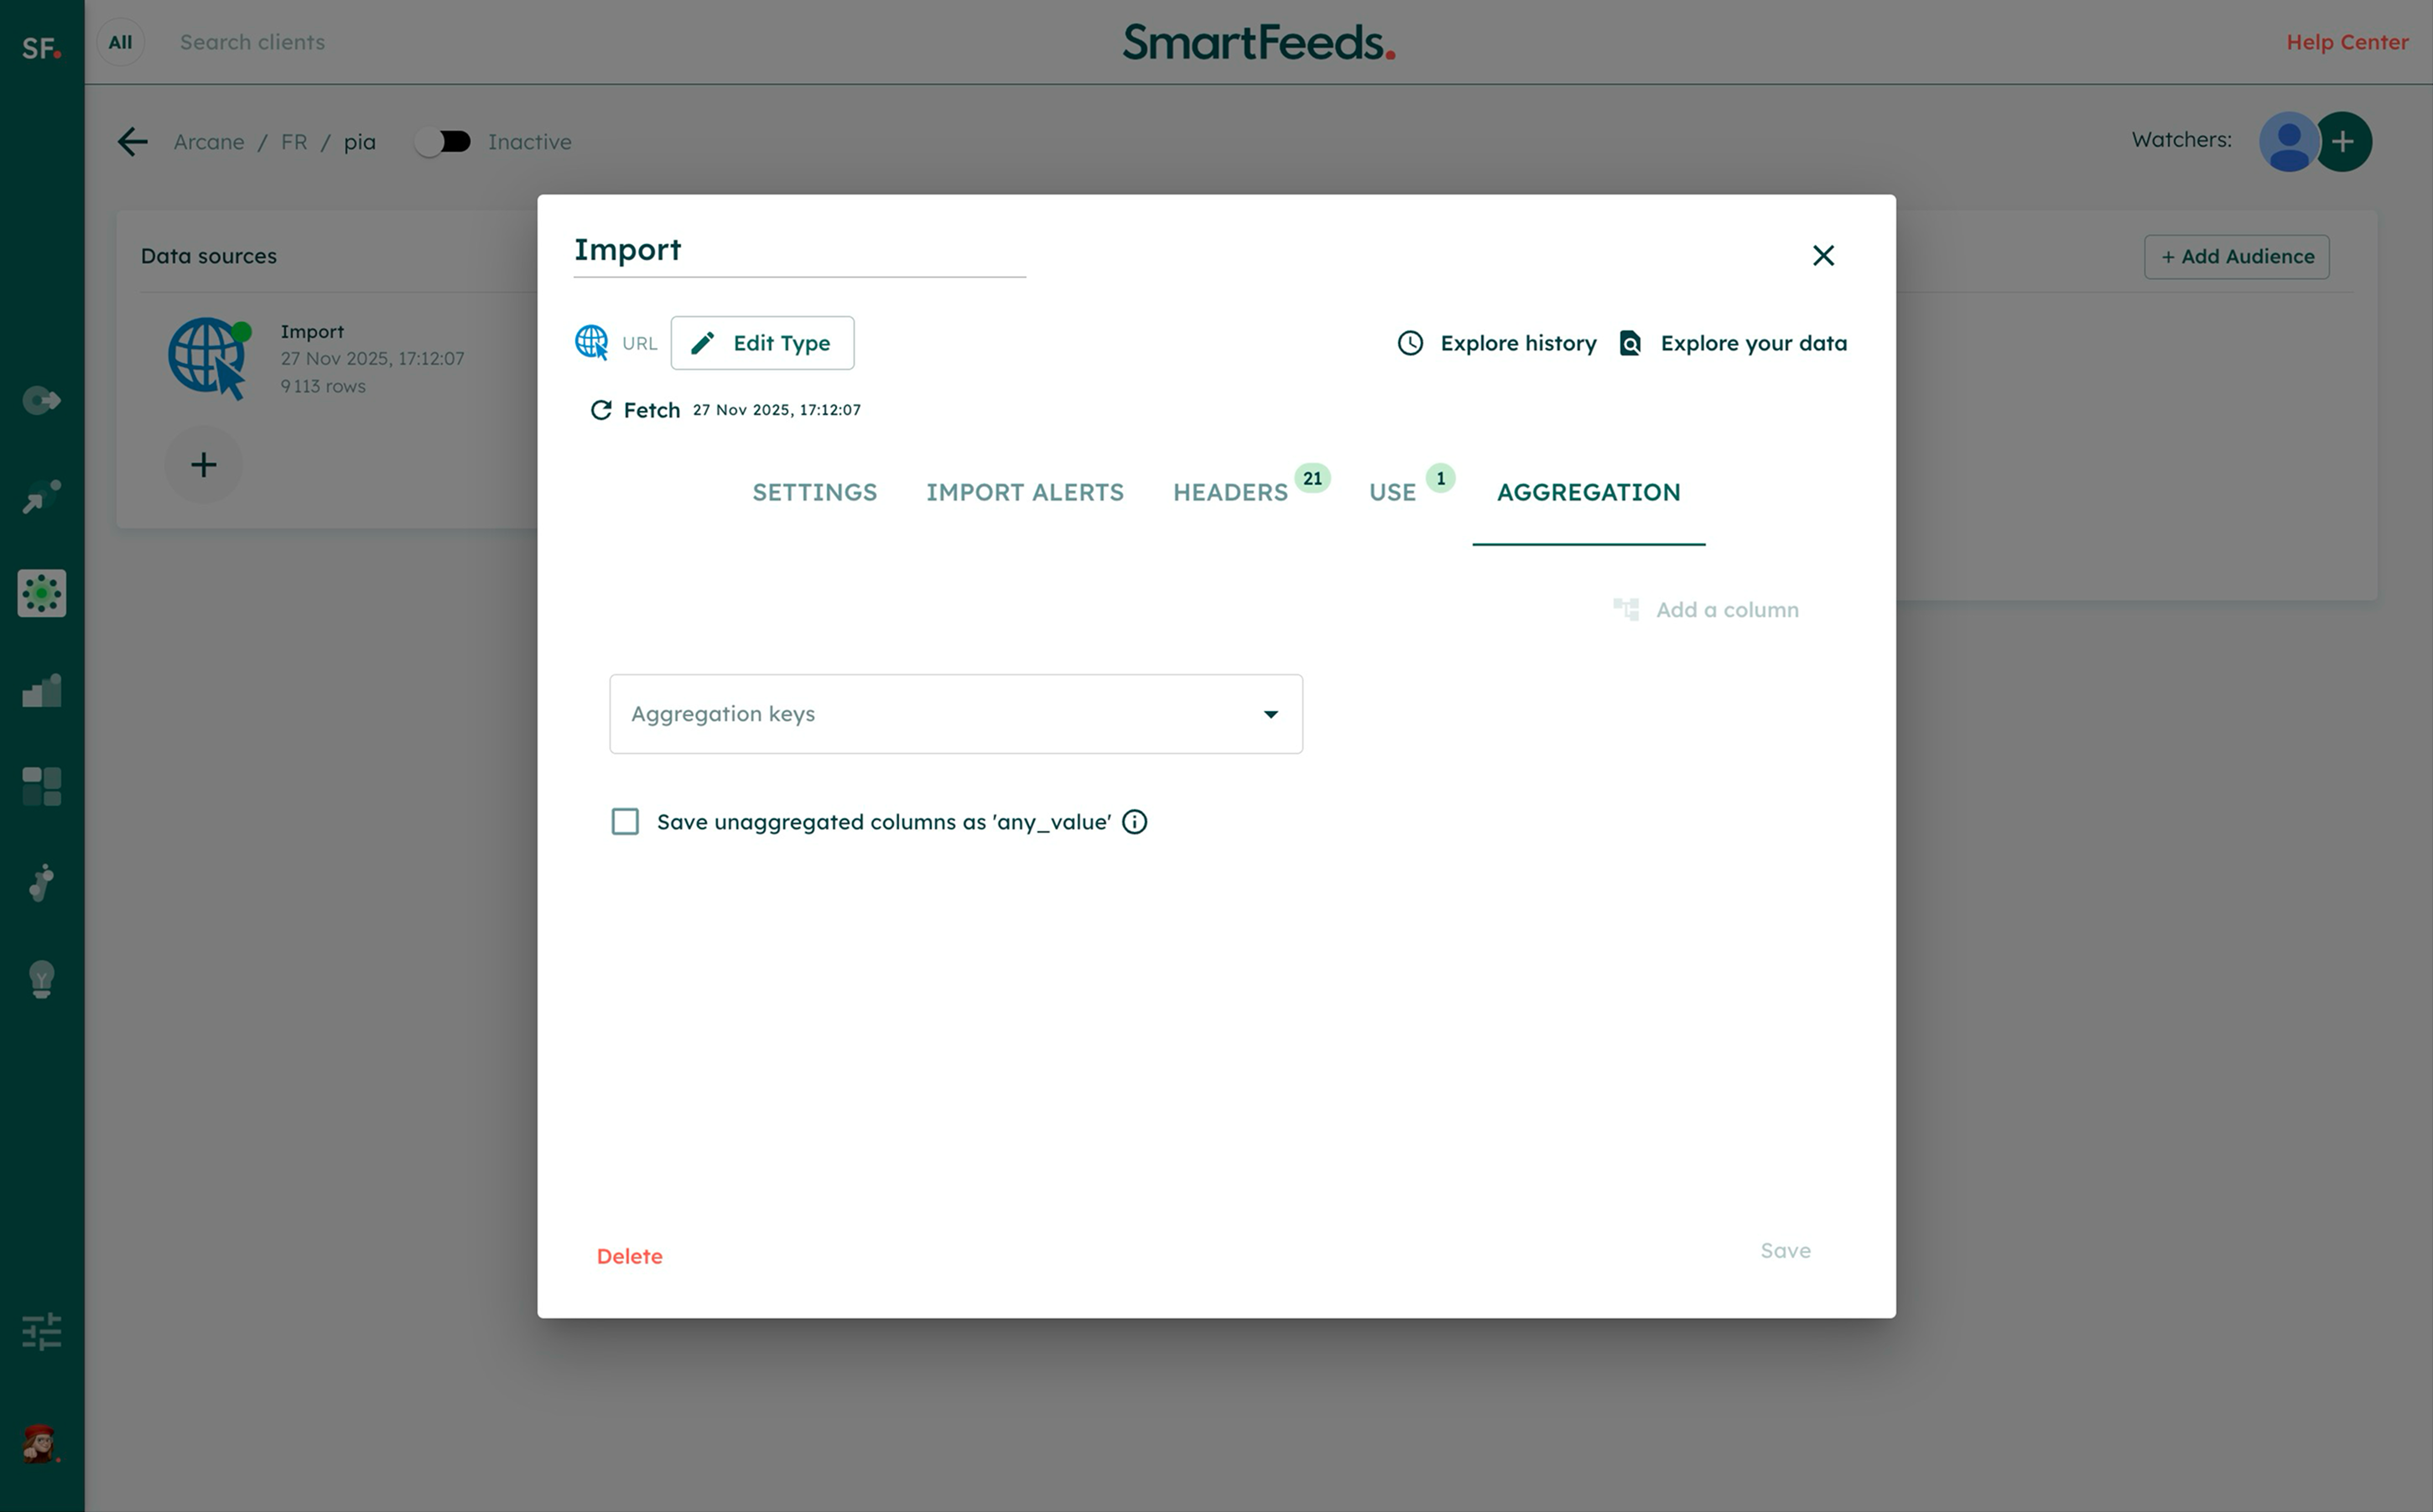
- Open your Import:
Go to Product Flow, select your "Orders/Transactions" data source, and click on the Aggregation tab.
- Select the aggregation key (Group By):
Choose the column that represents your client ID (e.g.,Client_ID).
- (Optional) Handle Other Columns:
You can check the box "Save unaggregated columns as ‘any_value’".
Why? It's a time-saver to automatically keep static info like "City" or "Phone" without manual setup.
Caution: Only use this for data that is the same for all rows (like an address). Do not use it for variable data (like product names), as the system will pick one value at random. - Create New Operations:
Define what stats you want to calculate for your segments. - To find VIPs: Create a column
Total_Revenueby selecting thesumaction on thePricecolumn. - To find Inactive Users: Create a column
Last_Order_Dateby selecting thelatestaction on theDatecolumn. - To find Frequent Buyers: Create a column
Order_Countby selecting thecountaction on theOrder_IDcolumn.
- To find VIPs: Create a column
- Filter Before Aggregation (Optional):
You can filter data for a specific column before the calculation happens. Click the filter icon next to an output column to open the rule editor. - Example: You want to calculate
Total_Revenue(Sum of Price). To exclude cancelled orders, add a filter whereOrder_Statusequals "Completed". The system will only sum the prices of completed orders.
- Example: You want to calculate
- Save:
When you save, SmartFeeds generates a new "Aggregated File" containing only your new columns.
This file replaces the original "Raw File" in your active workflow and will be used for all following steps (Joins, Filters, Mappings). Your raw data is not lost. You can still view the original file structure by selecting it from the dropdown menu in the Explore tab.
Critical Warning - Broken Links: Before saving, check the "Use" tab. If this import is currently used in other parts of SmartFeeds (like a Mapping or a Join), saving the aggregation will break these links because the file structure changes. You must manually fix these errors immediately after saving.
- Example: You want to calculate Total_Revenue (Sum of Price). To exclude cancelled orders, add a filter where Order_Status equals "Completed". The system will only sum the prices of completed orders.
- Example: You want to calculate Total_Revenue (Sum of Price). To exclude cancelled orders, add a filter where Order_Status equals "Completed". The system will only sum the prices of completed orders.
Step 2: Link Your Data (Join)
Goal: Attach contact details (Email/Phone) to your new stats so Audience Flow can identify the users.
Now that you have a clean "Stats File" (from Step 1), you need to link it to your "Client File" (which contains the emails).
- Go to Product Flow > Data Sources.
- Locate your Client Database import (the one with emails).
- Click on Join.
- Configure the Join:
- Main File: Your Client Database (contains Emails).
- Joined File: Your newly Aggregated Orders File (contains Stats).
- Join Key: Select the
Client_IDin both files.
- Save: You now have a "Super Data Source" containing both Who they are (Email) and What they did (Total Spend, Last Date).
Step 3: Create Your Audience
Goal: Use your Data source to build the actual segment for your campaign.
- Navigate to Audience Flow.
- Click + Add an audience.
- Select Data Source
- Define the Rules (Formula Editor): Now you can easily write rules using your new aggregated columns:
- Example 1: Target VIPs (High Spend):
IF Total_Revenue > 500 THEN "VIP" ELSE "Standard"(Based on the aggregated columnTotal_Revenueyou created in Step 1) - Example 2: Target At-Risk Users (No purchase in 6 months):
IF Days_Since(Last_Order_Date) > 180 THEN "Churn_Risk"(Based on the aggregated columnLast_Order_Date)
- Example 1: Target VIPs (High Spend):
- Export: Connect this audience to Google Ads or Meta. Since you joined the data in Step 2, the system will automatically map the hashed Emails/Phones to the platform.
→ To learn more about how to use Audience Flow, see the article Audience Flow Overview
Common Use Cases (Examples)
The examples below are general guidelines, not rigid rules. You should always adapt these strategies based on:
- Your specific business goals: (e.g., prioritizing Retention vs. Loyalty vs. Growth).
- Your industry: A "High Spender" in Luxury fashion is very different from a "High Spender" in Mass-Market Retail.
- Seasonality: You might want to adjust your criteria during Sales or Black Friday.
Here are the most common audiences marketers create using aggregation:
1. The "Champions" (VIPs)
- Who are they? Your absolute best customers. They buy frequently, spend a lot, and purchased recently.
- Strategy: Pamper them. Give early access to new products or exclusive events.
- Aggregation Used:
sum(Revenue),latest(Last Date). - Audience Rule:
Total_Revenue > HighANDLast_Order_Date is recent.
2. The "Loyalists" (Frequency)
- Who are they? They buy regularly, even if the amount isn't huge. They are your steady base.
- Strategy: Enrollment in Loyalty Programs, subscription offers.
- Aggregation Used:
count(Order IDs). - Audience Rule:
Order_Count > 5.
3. The "Big Spenders" (High Average Basket)
- Who are they? They may not buy often, but when they do, they spend a lot.
- Strategy: Upsell premium products or bundles.
- Aggregation Used:
avg(Price/Order Value). - Audience Rule:
Average_Order_Value > High.
4. The "Hibernating VIPs" (Win-Back)
- Who are they? They used to be champions but stopped buying.
- Strategy: Aggressive "We Miss You" discounts or reactivation campaigns.
- Aggregation Used:
sum(Revenue),latest(Last Date). - Audience Rule:
Total_Revenue > HighANDLast_Order_Date > 6 months ago.
5. The "New Customers" (Nurturing)
- Who are they? They just made their first purchase.
- Strategy: Welcome series, cross-sell to turn them into repeat buyers.
- Aggregation Used:
earliest(Date). - Audience Rule:
First_Order_Date < 30 days ago.
6. The "Window Shoppers" (Prospects)
- Who are they? They visit your site often but have never bought anything (Requires Web Visit data).
- Strategy: First purchase discount to trigger conversion.
- Aggregation Used:
count(Visits),sum(Revenue). - Audience Rule:
Visit_Count > 5ANDTotal_Revenue == 0.
Common Use Cases
Understanding Segmentation Goals:
Segmentation serves multiple purposes depending on your marketing goals. Below are detailed examples of how segmentation can be used effectively. By tailoring segmentation to your specific goals, you can fine-tune how products are prioritized across campaigns.
Improving Budget Allocation:
By tagging products based on performance, you can prioritize your advertising budget. For instance:
- "High Performers": Assign maximum visibility to these products using Performance Max campaigns.
- "Zombie Products with Potential": Reassess these products and explore whether slight promotional boosts or visibility enhancements can lead to better results.
- "Low Performers": Reduce spend and monitor their performance over time.
Seasonal Campaigns:
For promotions like Black Friday or end-of-season sales, create specific tags (e.g., "Jackpot" or "Braderie 23") to segment seasonal products separately.
These tags can be combined with standard performance metrics to adjust campaigns dynamically during peak periods.
Handling Underperforming Products:
Products with low visibility or no impressions ("produits_zombies") can be tagged and reviewed for potential reactivation through tailored strategies.
Dynamic Strategy Adjustments:
Use segmentation to experiment with strategies for mid-tier products. For instance, if "Mid Performers" show signs of growth, consider testing increased bids or broader targeting.
Quick Answers to Common Issues
Can I skip the Join step?
You can skip the Join step only if your behavioral file (Orders) already contains the customer's contact details (Email/Phone) on every line. However, in most cases, personal data and transaction data are kept in separate files (File A and File B). The Join step acts as a "bridge" to link these datasets using a common key.
→ For a detailed guide on how to merge files, see the join article
I have a file with one line per order, how can I segment by "Average Order Value"?
You cannot do this directly because the "Average" (AVG) needs to be calculated first.
Solution: Use Aggregation!
- Select your "Order Amount" column.
- Choose the AVG (Average) action.
- This creates a new column
Average_Order_Value(one per customer) that you can then use in your segmentation rules (e.g.,IF Average_Order_Value > 100).
How can I add new columns to an existing aggregated file?
Simply go back to the Aggregation tab of your import and create the new columns you need (e.g., adding Category for Sales).
Warning: Before saving, check the "Use" tab. If you modify or remove columns that are already used in a mapping or a join, you will break those links. You will need to manually update your mappings and joins immediately after saving your changes.
Related Articles
For further assistance with SmartFeeds, consider reviewing these articles:
For additional help, feel free to reach out via our Contact Us page.